Mann-Whitney U Test
U statistic: 49463677.0
p-value: 0.0040
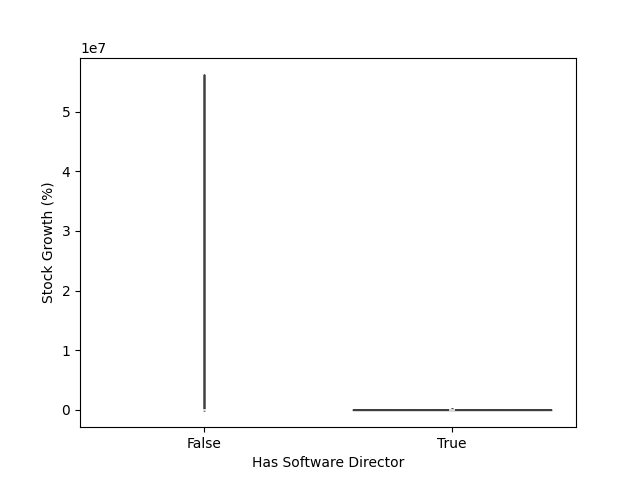
Exploratory filing-to-filing stock growth comparisons.
U statistic: 49463677.0
p-value: 0.0040
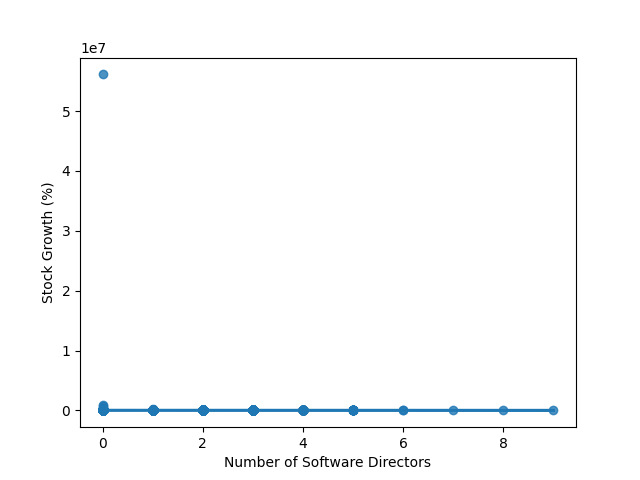
y = 17252.8546 * x + 15089.7046
R2: 0.0
p-value: 0.2935
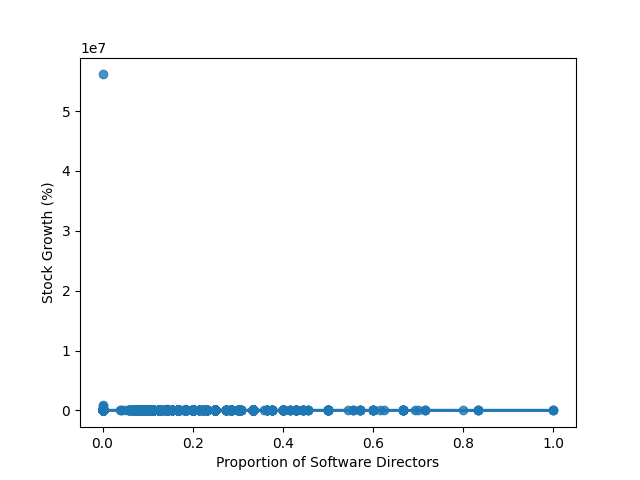
y = 282490.4244 * x + 13122.9073
R2: 0.0001
p-value: 0.0383
| Sector | U statistic | U p-value | Slope Num | R² Num | p Num | Slope Prop | R² Prop | p Prop |
|---|---|---|---|---|---|---|---|---|
| Basic Materials | 57878.0 | 0.7780 | -8.3112 | 0.0006 | 0.3841 | -53.9597 | 0.0004 | 0.4736 |
| Communication Services | 48062.0 | 0.5659 | 0.6318 | 0.0 | 0.9085 | -6.7344 | 0.0 | 0.8672 |
| Consumer Cyclical | 268800.0 | 0.1540 | -495.6345 | 0.0 | 0.7814 | -4199.3353 | 0.0 | 0.7822 |
| Consumer Defensive | 40879.0 | 0.9514 | -5.4195 | 0.0001 | 0.7845 | -46.5064 | 0.0 | 0.8115 |
| Energy | 16224.0 | 0.1850 | -20.0211 | 0.0001 | 0.7680 | -199.0336 | 0.0001 | 0.7426 |
| Financial Services | 3788226.0 | 0.0006 | -67.7713 | 0.0 | 0.5148 | -674.2199 | 0.0 | 0.4953 |
| Healthcare | 573246.0 | 0.2918 | -448.4865 | 0.0 | 0.6458 | -2652.1354 | 0.0 | 0.6576 |
| Industrials | 459215.5 | 0.2346 | -0.7489 | 0.0 | 0.8759 | -4.4579 | 0.0 | 0.9099 |
| Real Estate | 233299.0 | 0.8426 | -18.4151 | 0.0 | 0.7745 | -189.5385 | 0.0001 | 0.7349 |
| Technology | 2715640.0 | 0.6980 | 30285.6647 | 0.0 | 0.6262 | 570191.824 | 0.0002 | 0.2518 |
| Utilities | 6287.0 | 0.5199 | 18.1872 | 0.0281 | 5.42e-05 | 215.6031 | 0.0248 | 0.0002 |
This is an exploratory screen based on available filing-date stock prices. It is not a causal model.